Memory tweaks, not leaks
posted by Jeff | Saturday, February 10, 2024, 7:16 PM | comments: 0I wrote yesterday about my memory pressure on the web apps... turns out there's a magic cure.
First off, I'm not an expert in memory management, which is why I enjoy writing code for a managed framework. It abstracts all of that away for you. But also, the thing about stateless web apps is that all of the objects they create are ephemeral. It hears the request, puts some bits together, sends them back, and forgets it ever happened. This is one of the reasons it was so frustrating to see CoasterBuzz pushing 500 MB in memory. If all this stuff is ephemeral, why is it hanging on to all of this memory? I've seen some traffic increases in the last year, but nothing that dramatic.
As it turns out, I learned that there are two different modes of garbage collection, server and workstation, and oddly enough, the server variety does background GC less frequently to devote all the resources to servicing requests. That's neat and all, when you're squeezing a bunch of containers into 3.5 gigs of a virtual Linux box, it gets tight. It can't be sloppy.
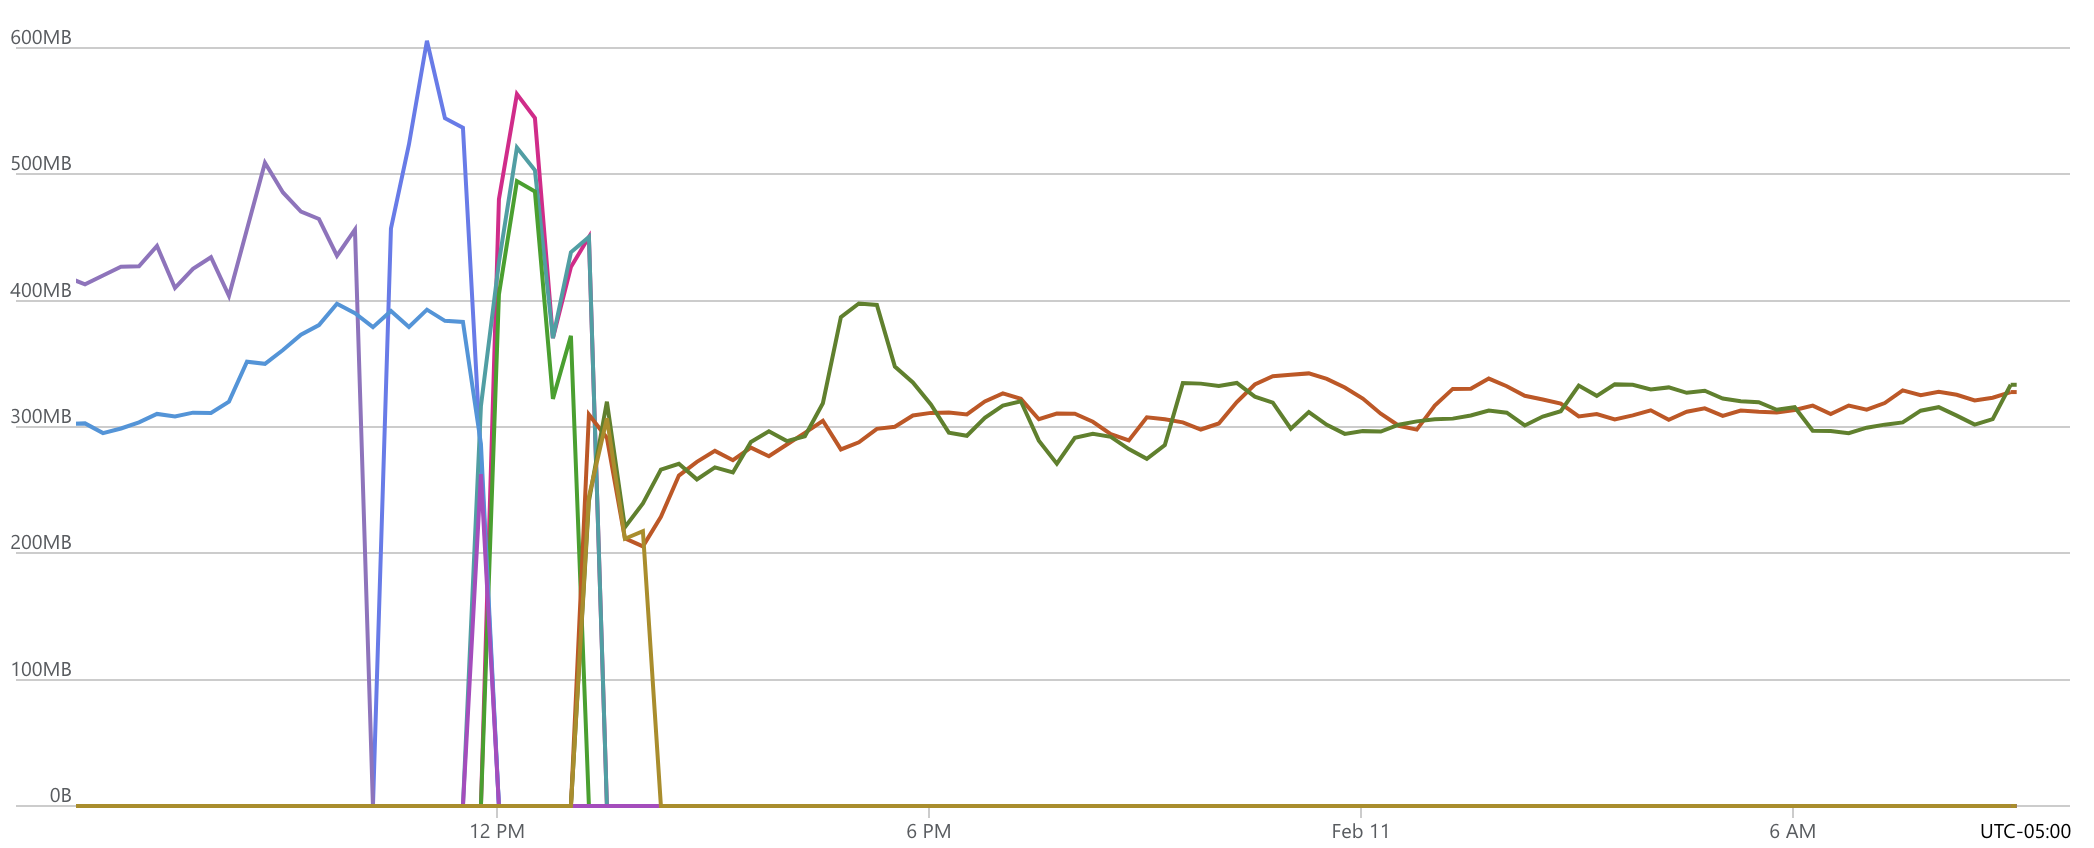
Today I learned that .Net 8 shipped with something called "dynamic adaptations to application sizes." I guess it's a better way to decide how many managed heaps to have, and how often to run GC. It just requires adding a couple of environment variables, so I did that. While CoasterBuzz was bumping up against 500 MB or higher before, now it's leveling off at 300.
The only reason I can afford any of this redundancy and elastic scalability is because I moved everything into Linux app services on Azure a few years ago. The cost is one-third of what it was for Windows. However, that does come at a price, because while Windows treats each site as its own process, Linux wraps everything in containers, and all of the overhead that includes. So one Windows app service node with 1 vCPU/1.75gb RAM costs $75, but on Linux two nodes of 2 vCPU/3.5gb RAM is $50.
The hosted forum product is running on two nodes of vCPU/1.75gb RAM for $25, and it consistently uses less than 200 MB. Page rendering times are generally sub-50ms. Considering they're under 10ms on my local computer, I imagine perf could be great if I was spending more than $25!
Anyway, magic fix. The erratic part below is when I was deploying and scaling, but after the tweak, very consistent memory usage.
Comments
No comments yet.
